Fine-tuning with a Specific Loss Function
When you fine-tune, the model trains on your dataset to tailor predictions to your specific dataset. You can specify the loss function to be used during fine-tuning using thefinetune_loss argument. Below are the available loss
functions:
"default": A proprietary function robust to outliers."mae": Mean Absolute Error"mse": Mean Squared Error"rmse": Root Mean Squared Error"mape": Mean Absolute Percentage Error"smape": Symmetric Mean Absolute Percentage Error
How to Fine-tune with a Specific Loss Function
Step 1: Import Packages and Initialize Client
First, we import the required packages and initialize the Nixtla client.Step 2: Load Data
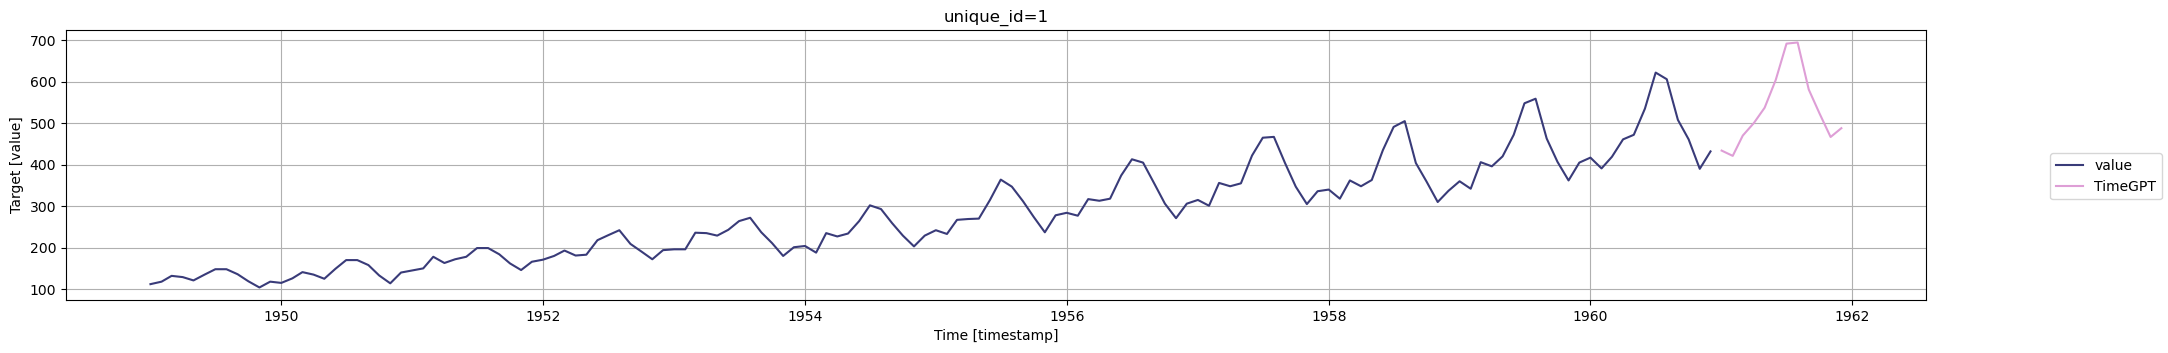
Load your data and prepare it for fine-tuning. Here, we will demonstrate using an example dataset of air passenger counts.| unique_id | timestamp | value | |
|---|---|---|---|
| 0 | 1 | 1949-01-01 | 112 |
| 1 | 1 | 1949-02-01 | 118 |
| 2 | 1 | 1949-03-01 | 132 |
| 3 | 1 | 1949-04-01 | 129 |
| 4 | 1 | 1949-05-01 | 121 |
Step 3: Fine-Tune the Model
Let’s fine-tune the model on a dataset using the mean absolute error (MAE). For that, we simply pass the appropriate string representing the loss function to thefinetune_loss parameter of the forecast method.
Explanation of Loss Functions
Now, depending on your data, you will use a specific error metric to accurately evaluate your forecasting model’s performance. Below is a non-exhaustive guide on which metric to use depending on your use case. Mean absolute error (MAE)- Robust to outliers
- Easy to understand
- You care equally about all error sizes
- Same units as your data
- You want to penalize large errors more than small ones
- Sensitive to outliers
- Used when large errors must be avoided
- Not the same units as your data
- Brings the MSE back to original units of data
- Penalizes large errors more than small ones
- Easy to understand for non-technical stakeholders
- Expressed as a percentage
- Heavier penalty on positive errors over negative errors
- To be avoided if your data has values close to 0 or equal to 0
- Fixes bias of MAPE
- Equally sensitive to over and under forecasting
- To be avoided if your data has values close to 0 or equal to 0
Experimentation with Loss Function
Let’s run a small experiment to see how each loss function improves their associated metric when compared to the default setting. Let’s split the dataset into training and testing sets.| mae | mse | rmse | mape | smape | |
|---|---|---|---|---|---|
| Metric improvement (%) | 8.54 | 0.31 | 0.64 | 31.02 | 7.36 |